Radiometric dating is the process by which scientists use radioactive trace elements to determine the age of fossils and artifacts (carbon dating is a type of radiometric dating). It’s a super fundamental concept in paleontology, geology, archaeology, and astronomy–it’s how we know the age of the earth, how we can put the history of life into an organized timeline called the geologic time scale, and provides clues about all kinds of other long-term geologic processes like continental drift and the formation of mountains and ocean rifts. However, how radiometric dating actually works is not only a little hard to understand, but extremely hard to research; it took me a lot of sources and fortuitous encounters of keywords to put together a comprehensive picture. In this post, I’ll compile all that into a single place, so that people like me trying to understand it in the future will have a one-stop answer!
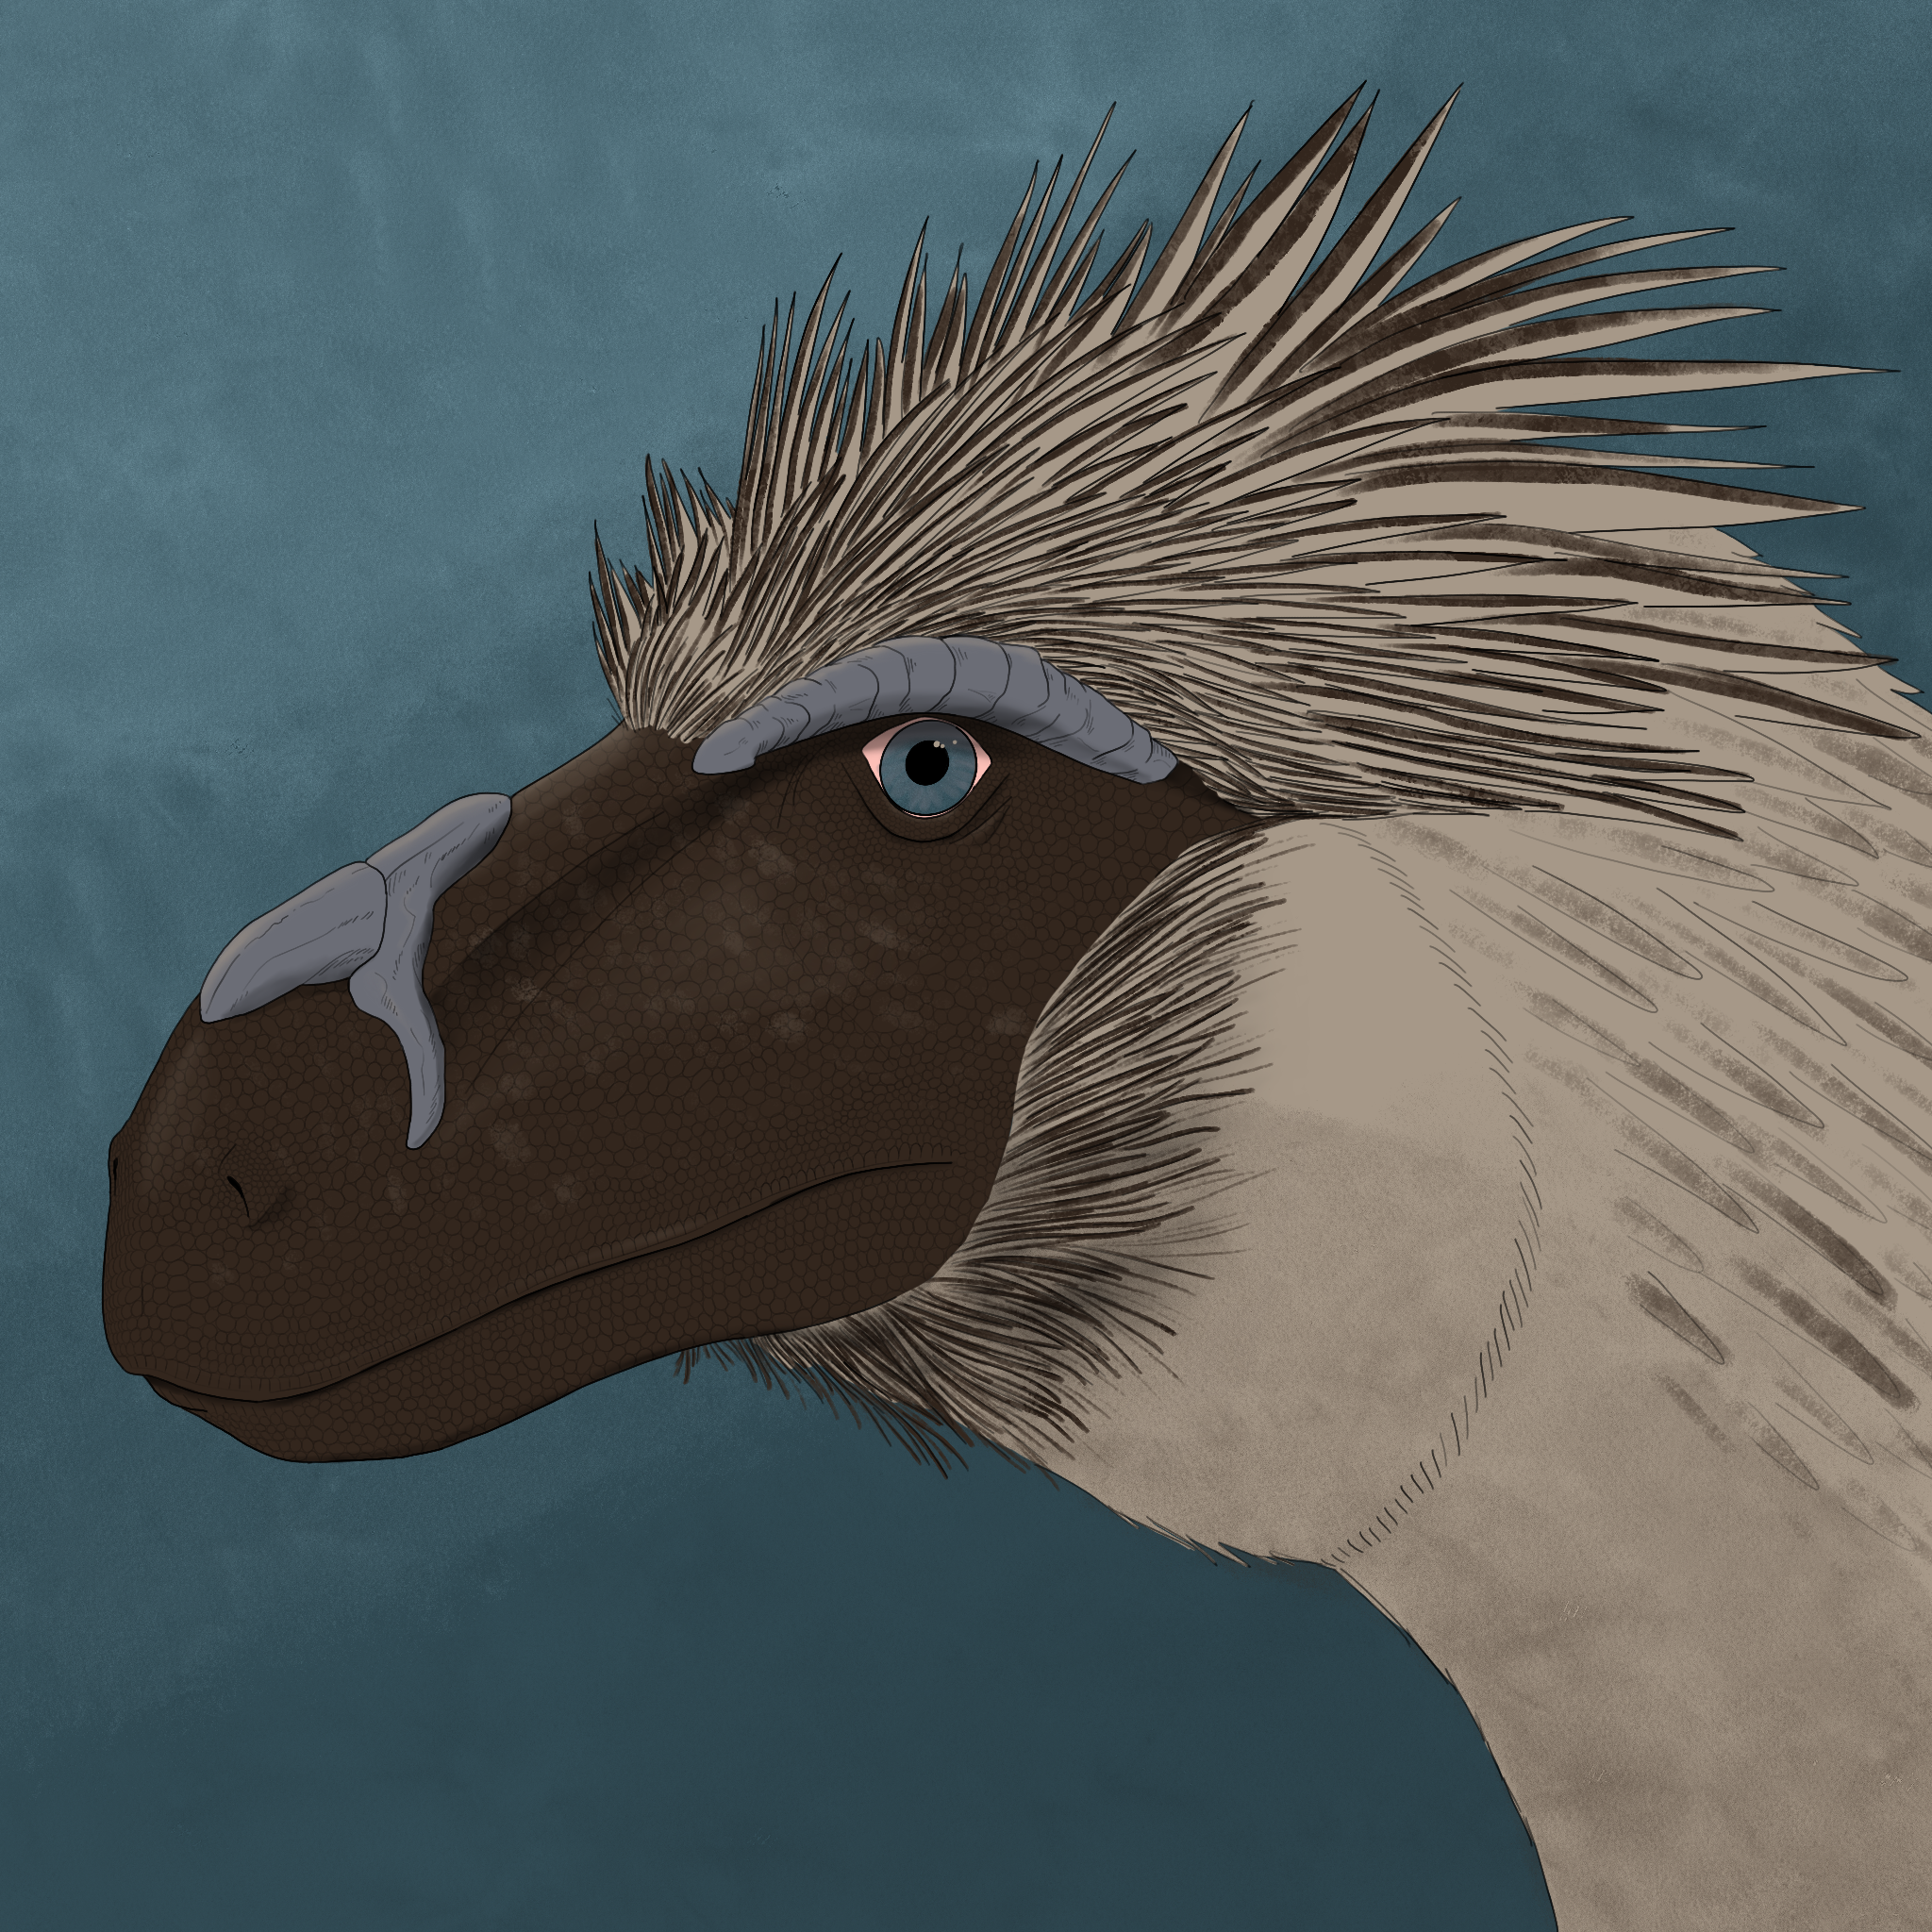
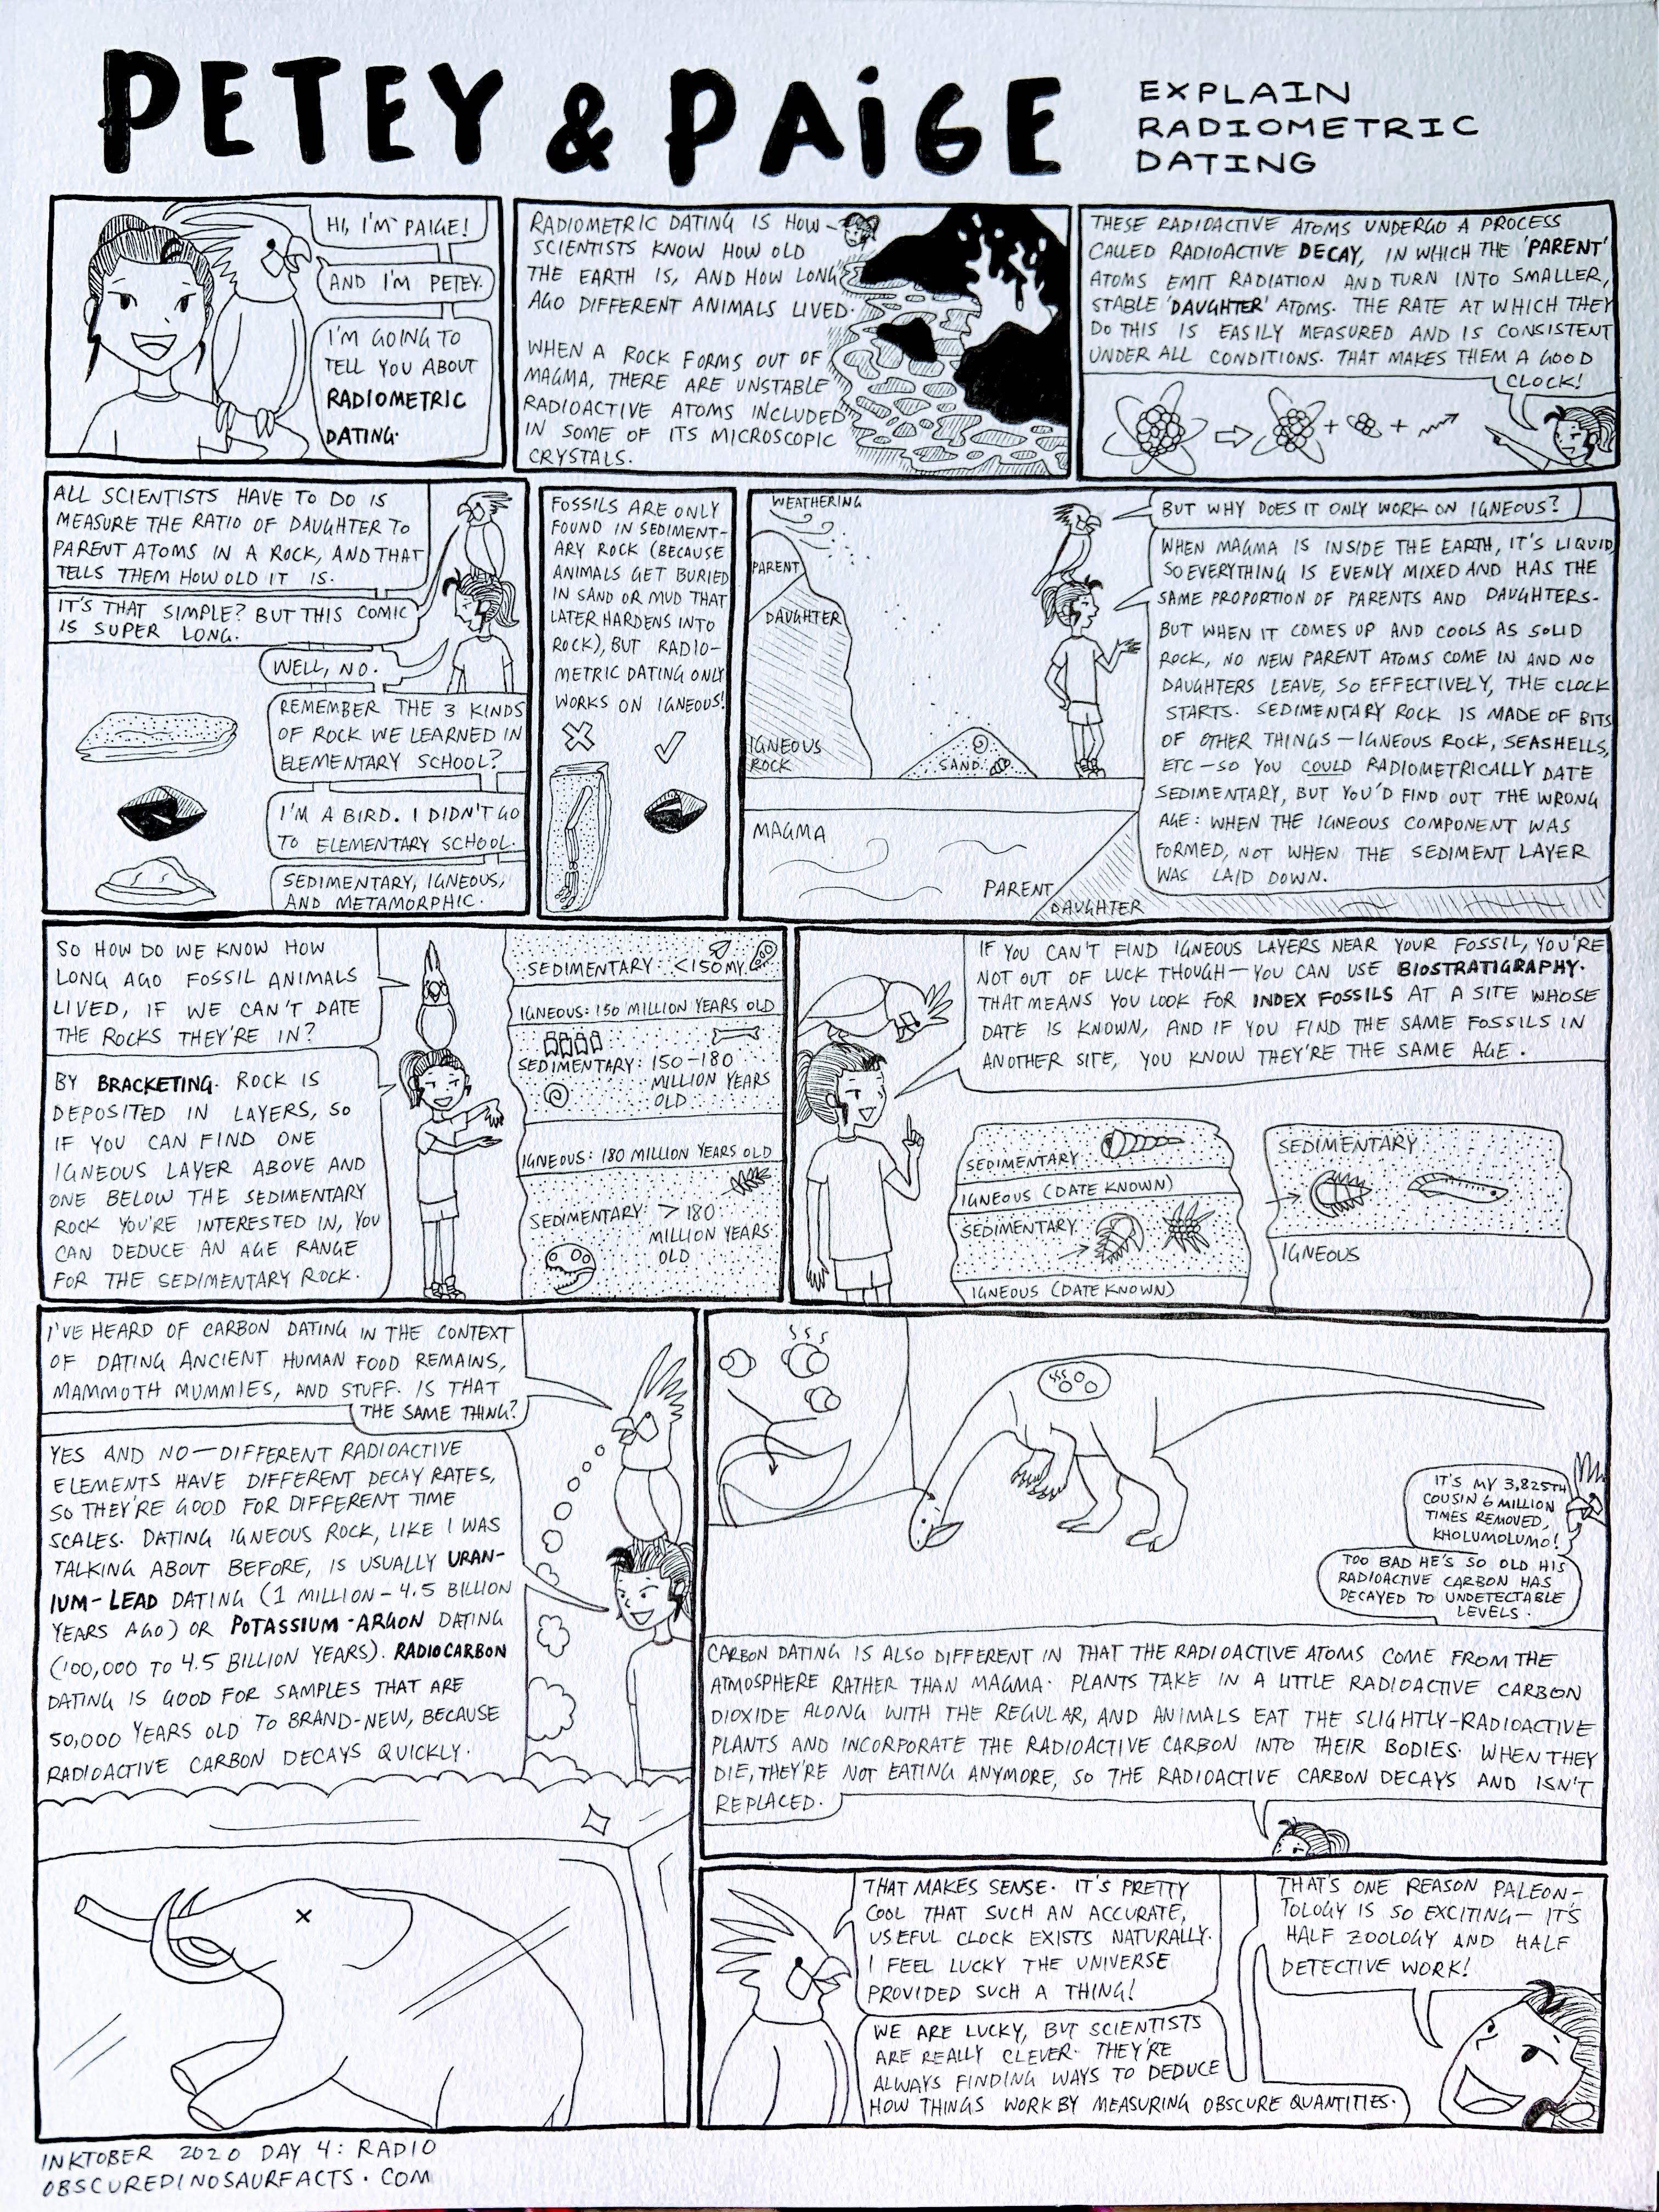
My first foray into learning about radiometric dating was because of the 2020 Inktober prompt “radio”. The comic I made then (using characters I intended to expand upon further, which still hasn’t happened yet) is a good jumping-off point for the rest of this post, so please scroll back up and read the page image up top if you haven’t already.
While I covered the very basics there–like why it only works on igneous, what biostratigraphy is, and some applications–I left a lot of material unaddressed due to the size limitations of my paper. So here’s a quick crash course to more formally tackle the fundamentals. Feel free to skip to the next section if you are already familiar.
Basic concepts
An element is defined by the number of protons in its nucleus; each integer number of protons corresponds to a unique chemical element, from hydrogen with one proton to oganesson with 118. The number of protons largely dictates how the substance behaves: how it looks, how dense it is (with larger numbers of protons usually meaning denser materials, although the inter-atom structure also comes into play), and, indirectly (through influencing how many electrons it can have), how it behaves and what kinds of compounds it can form.
An isotope is a specific configuration of an element, defined by the number of neutrons in its nucleus. Sometimes carbon has six neutrons in its nucleus alongside the six protons, making it carbon-12 (twelve nuclear particles in total). But sometimes it has eight neutrons and six protons, making it carbon-14. These are two different isotopes of carbon.
Radioactive decay is a type of straight-up alchemy, by which I mean a process in which one substance transmutes into another (the other types of alchemy are nuclear fission and antimatter annihilation). There are a few different forms of radioactive decay, in which neutrons can turn into protons or vice versa, or entire helium atoms (groups of two protons and two neutrons) can be jettisoned from a nucleus, leaving the resulting nucleus as a different substance. Sometimes, multiple forms of radioactive decay happen in series, so that an unstable parent element turns into an unstable daughter, which turns into another unstable daughter, which finally turns into a stable daughter. By the way, stable isotopes are ones that don’t spontaneously radioactively decay, and unstable isotopes do spontaneously decay. Another way to describe it is that stable isotopes are non-radioactive (radioinert?) substances, while unstable isotopes are radioactive substances.
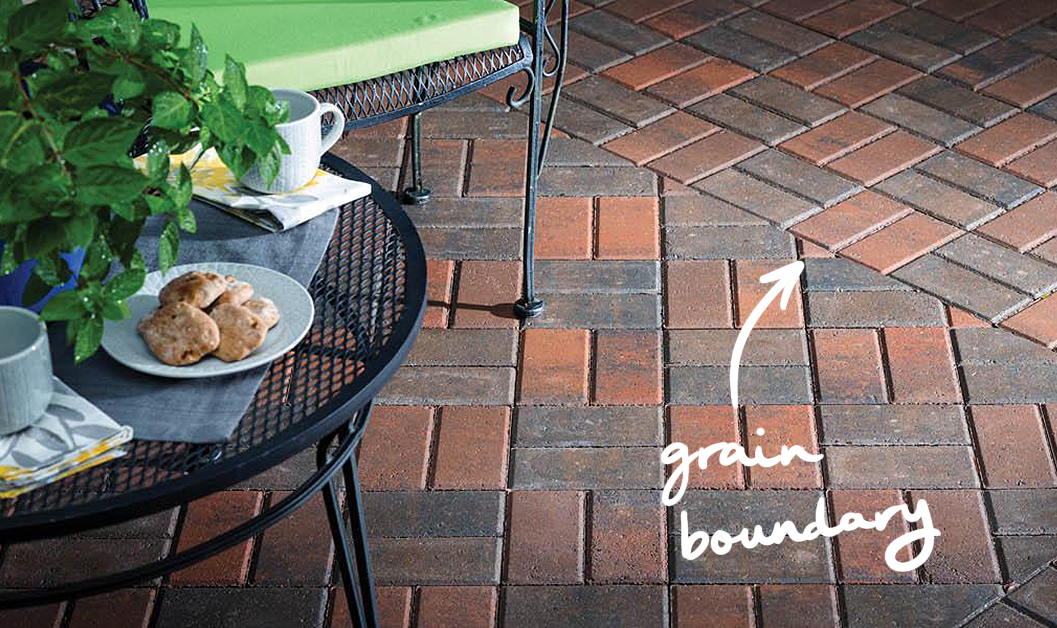
A crystal is a solid with an organized atomic structure. When a liquid cools into a solid (or when a solid precipitates (un-dissolves) out of a liquid solution) sometimes the atoms spontaneously self-organize into a crystal. Some substances, like glass, never self-organize, but most igneous rocks contain lots of types of crystals. Crystals are useful because their regular structure means that their chemical composition is basically uniform throughout. Imagine paving a decorative walkway with a repeating pattern of red-red-gray, red-red-gray bricks. (Get comfortable with this analogy, because we will be coming back to it a lot in this post.) You’re pulling bricks out of their disorganized piles and placing them into the pattern one at a time, and when you need a red brick, any red brick will do, but obviously you can’t use a gray one in that location. Once you’re done, if you take a photo of any part of the walkway, you’ll see two red bricks for each gray brick; this wasn’t the case when they were just in piles, since maybe you keep the pile of gray bricks somewhere out of frame. Usually, crystals don’t grow into those large, geometric gemlike things you probably envision when you read the word “crystal”; that requires a very large area of contiguous structure, also known as large grain size, analogous to our paver working by himself for a long time. What usually happens is multiple pavers start in different areas and work outward, and when they hit another paver’s work they find that they’ve been paving facing a different direction and their work doesn’t match up at the edges.
A mineral is a little piece of crystal in a rock, defined by its chemical composition and structure. In the paving example, if one guy uses red-red-gray and another uses blue-gray-blue-red, those would be two different minerals.
Isochron dating
The main question that puzzled me for a very long time even after researching for that comic was, how do we know the starting proportion of daughter atoms? If we don’t know the initial ratio of parent to daughter, we can measure the ratio now, but we won’t know how much time has passed.
The answer is known as isochron dating. (“Iso-chron” means “equal time” in Greek.) By taking multiple data points from different minerals in the same rock, we can gather enough information to solve not only for the age of the sample, but also for the starting proportion of daughter atoms. Let’s see how this works.
Isochron dating requires a second stable isotope of the daughter element to naturally be present in the rock in addition to the parent and the radiogenic (created through radioactive decay) daughter isotope. We’ll see why in a minute. For example, in rubidium-strontium dating, the parent isotope, radioactive rubidium-87 (rubidium containing 87 protons and neutrons total in its nucleus), decays into the stable daughter isotope, strontium-87 (strontium containing 87 protons and neutrons total–one of rubidium’s neutrons has turned into a proton). However, there are other stable isotopes of strontium that naturally occur, the most common of which is strontium-86 (strontium with one fewer neutron than strontium-87). Since strontium-86 is not produced in radioactive decay, we can expect its total numbers in the rock to stay the same over time. And we can use spectrometry (meaning “seeing-measuring”), or the fact that different substances emit different wavelengths of light when energized, to measure exactly how much of everything is currently there in the rock.
The key is the fact that when a crystal forms, it doesn’t care whether it picks up strontium-86 or strontium-87–it will incorporate whichever atom happens to be nearest into its structure. Using the paving example from the previous section, this would be as if some of the gray bricks had a flower engraving on them (let’s make the flower-marked ones analogous to strontium-86 for reasons that will become clear below), but the paver doesn’t care, and they’re mixed in with the rest of the gray bricks. If we assume the strontium-86 and strontium-87 are mixed sufficiently randomly on the scale we care about–which is quite a good assumption, since mineral crystals are way, way bigger than individual atoms, so the likelihood of clustering large enough to affect our measurement is infinitesimal–then,
regardless of the chemical formula of a mineral, if it contains *any* strontium at all, it will have the same *initial proportion* of strontium-87 to strontium-86 as all other minerals that were formed in the same cooling event.
In the paving example, if one paver is working on a red-red-gray section and another is doing blue-gray-blue-red, as long as they’re pulling from the same gray pile, they will have the same proportion of flower-patterned gray bricks to plain gray bricks as each other. They don’t have the same proportion of gray to other stuff, since the red-red-gray pavement has one gray in three and the blue-gray-blue-red pavement has one in four, nor do they have the same proportion of flowered gray to other stuff for the same reason, but the proportion of plain gray to flowered gray will be the same in any pavement that contains gray bricks at all.
Now imagine that over time, red bricks fade in the sun and turn gray, but blue bricks retain their color indefinitely. There are no flower-patterned red bricks, so the red bricks only turn into plain gray bricks. So, the proportion of plain gray to flowered gray increases over time, and the proportion of red to flowered gray decreases at the same rate. And the different initial amount of red in the different walkways means that the number of plain gray bricks will increase at a different rate for the different walkways.
(Here the metaphor breaks down a bit: in radioactive decay, a red brick will either turn into a gray brick, or it won’t, rather than being a continuum from bright red to dull red to reddish gray to gray. And there’s a random chance of a red brick turning suddenly gray at any time, they don’t all transition at the same time. Furthermore, unlike in paving stones, we can’t directly observe the crystal structure to deduce based on position which bricks should’ve been red originally.)
Here’s a key explaining the various parts of the analogy:
| Analogy | Real life |
| Plain red brick | Rubidium-87 atom |
| Plain gray brick | Strontium-87 atom |
| Flowered gray brick | Strontium-86 atom |
| Blue brick | Other non-radioactive atom |
| Fading in the sun | Radioactive decay |
| Initial bricklaying | Magma cooling event |
We have two data points and two unknowns. Our two data points are (proportion of red remaining to flowered gray, proportion of plain gray to flowered gray) in both pavement types, and our two unknowns are (a) how much time has passed and (b) how much plain gray there was to start. Let’s put some numbers to our example: let’s say we started with 48 bricks in each walkway, and half the starting gray bricks have flower engravings. In Walkway A, the red-red-gray one, there are initially 32 red bricks, 8 plain gray bricks, and 8 flowered gray ones. In Walkway B, the blue-gray-blue-red one, there are initially 24 blue bricks, 12 red bricks, 6 plain gray, and 6 flowered gray bricks. We’ll say half of the red bricks in each walkway turn gray every year. (In other words, red bricks have a half-life of one year. The reason more particles decay in a sample with more particles is because the things emitted during radioactive decay can trigger nearby particles to also decay.)
(But remember, in geology, we don’t know the initial conditions, so we would work backwards to figure them out. I’m just giving you the answer to start with so it’s easier to follow the derivation.)
After one year, Walkway A now has 16 red bricks, 24 plain gray bricks, and 8 flowered gray bricks, and Walkway B now has 24 blue bricks, 6 red, 12 plain gray, and 6 flowered gray.
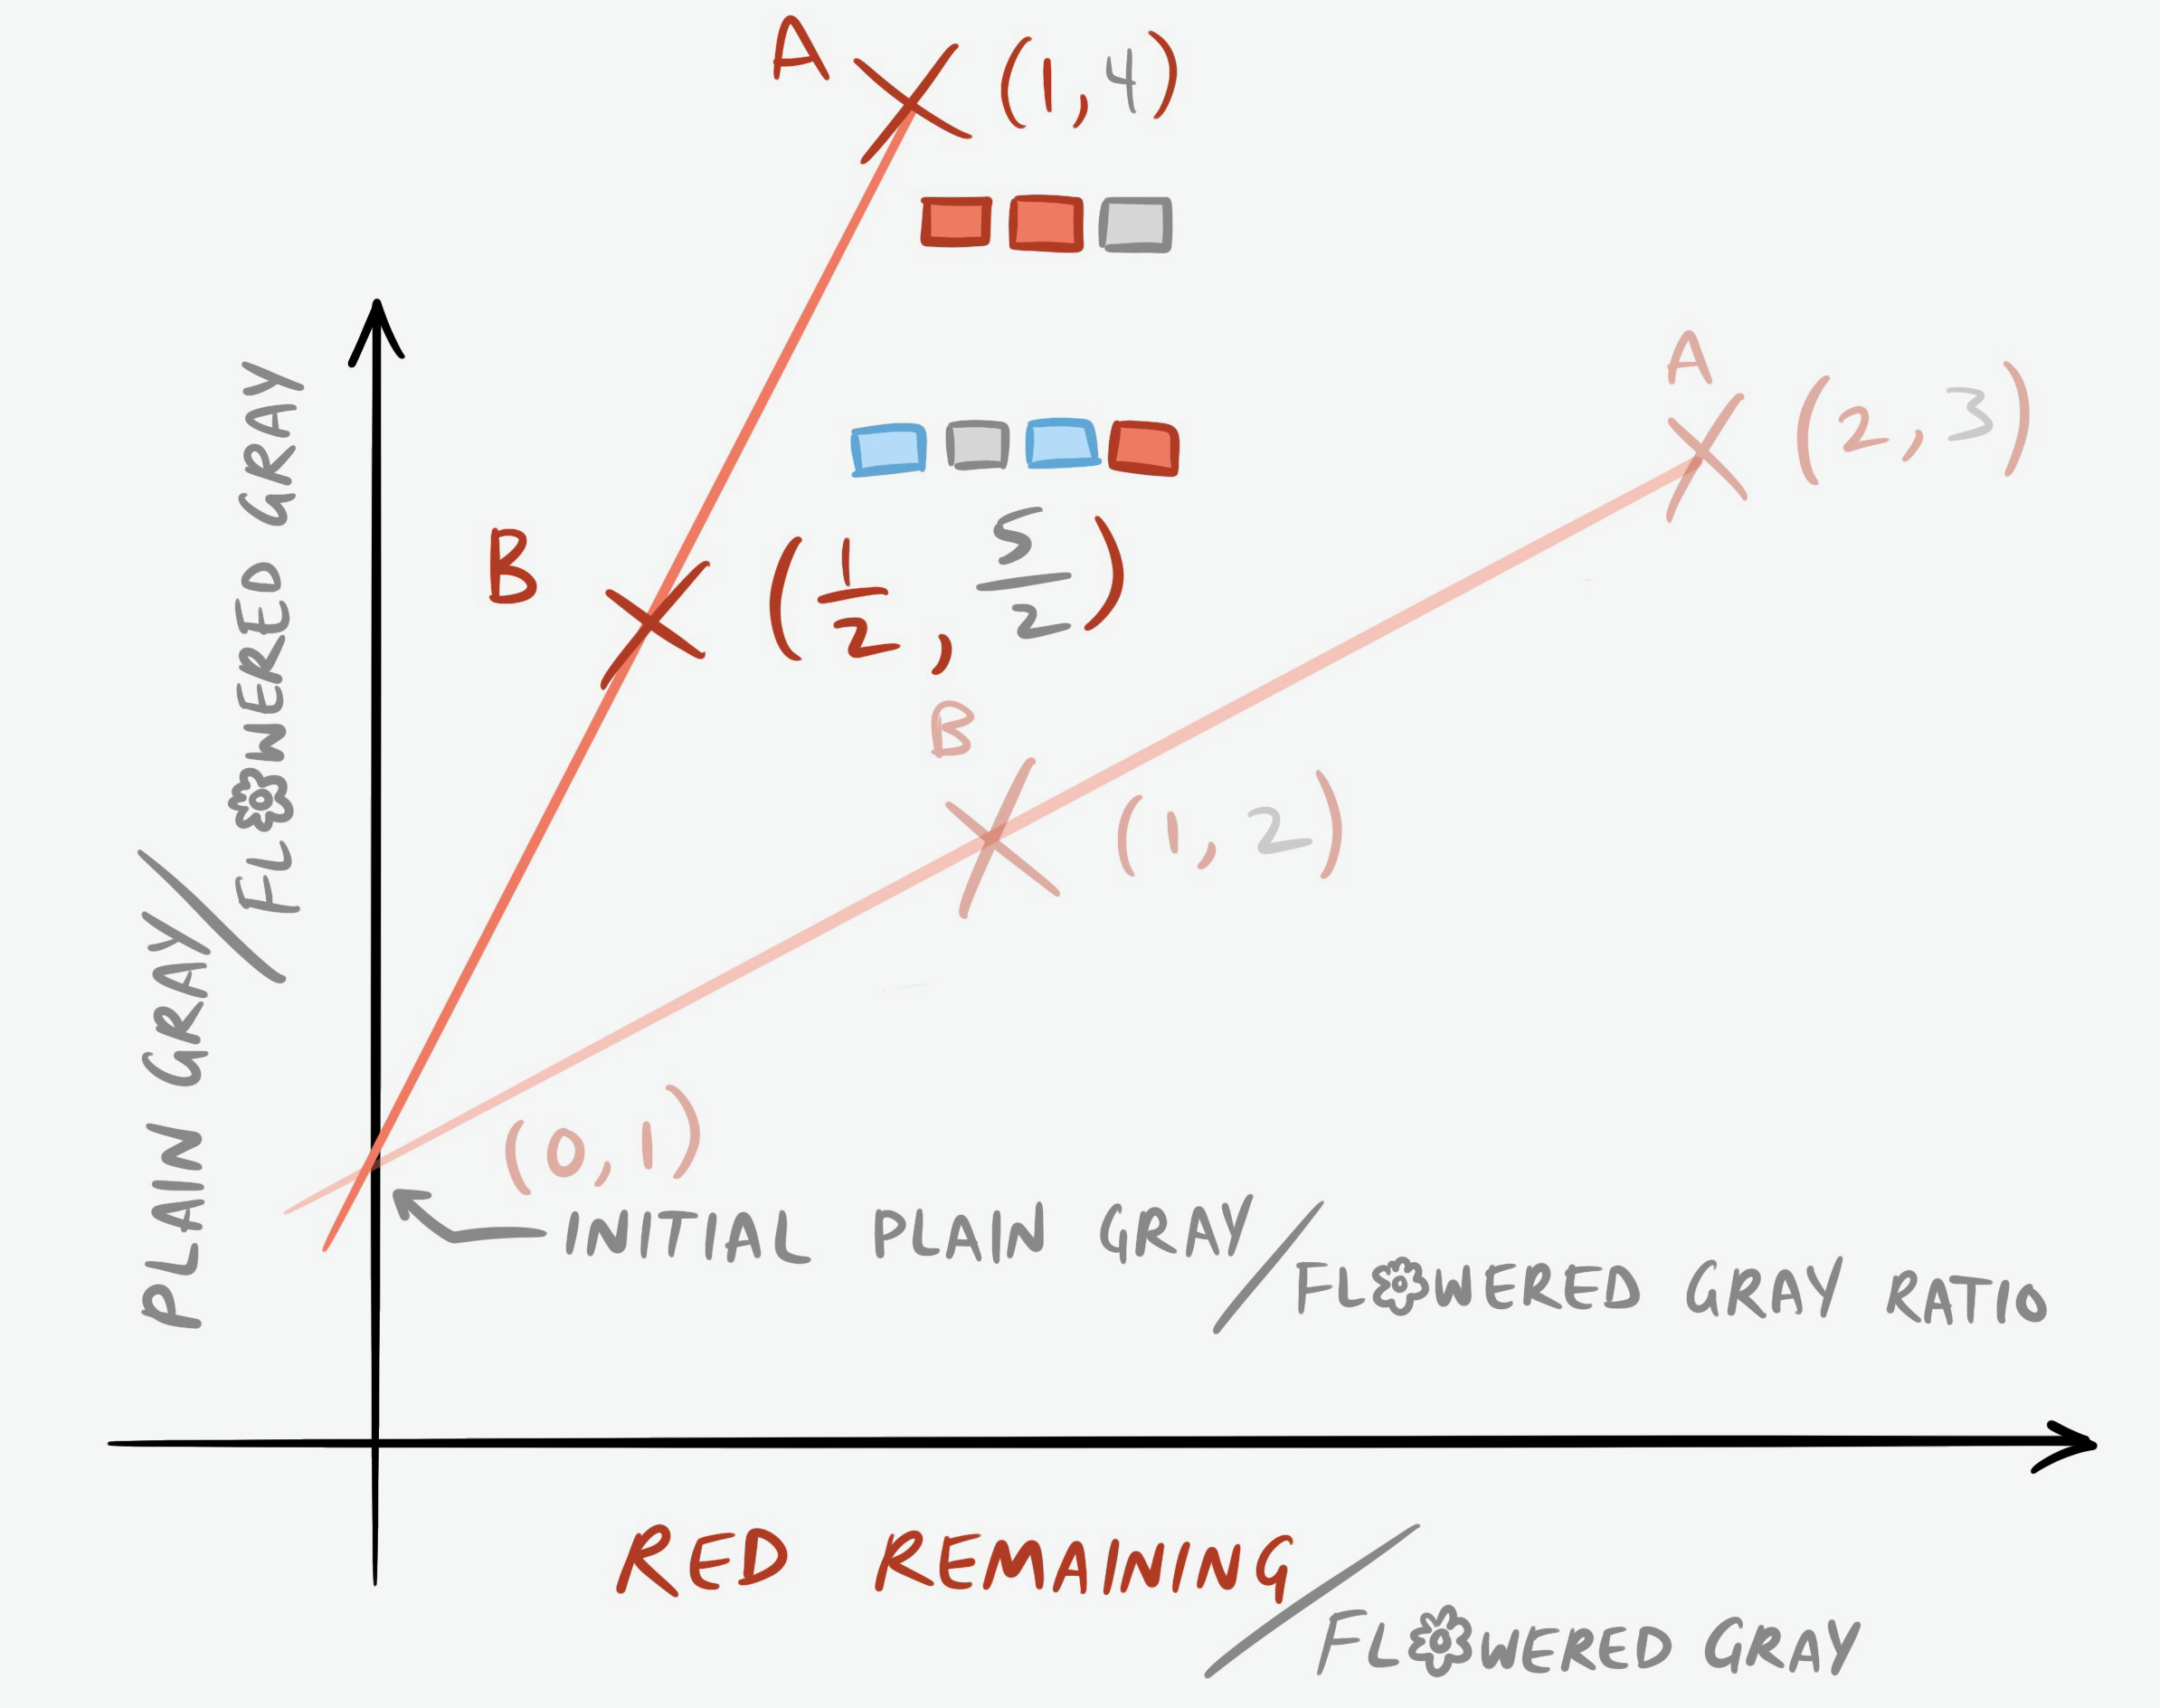
We can visualize this by creating an isochron plot:
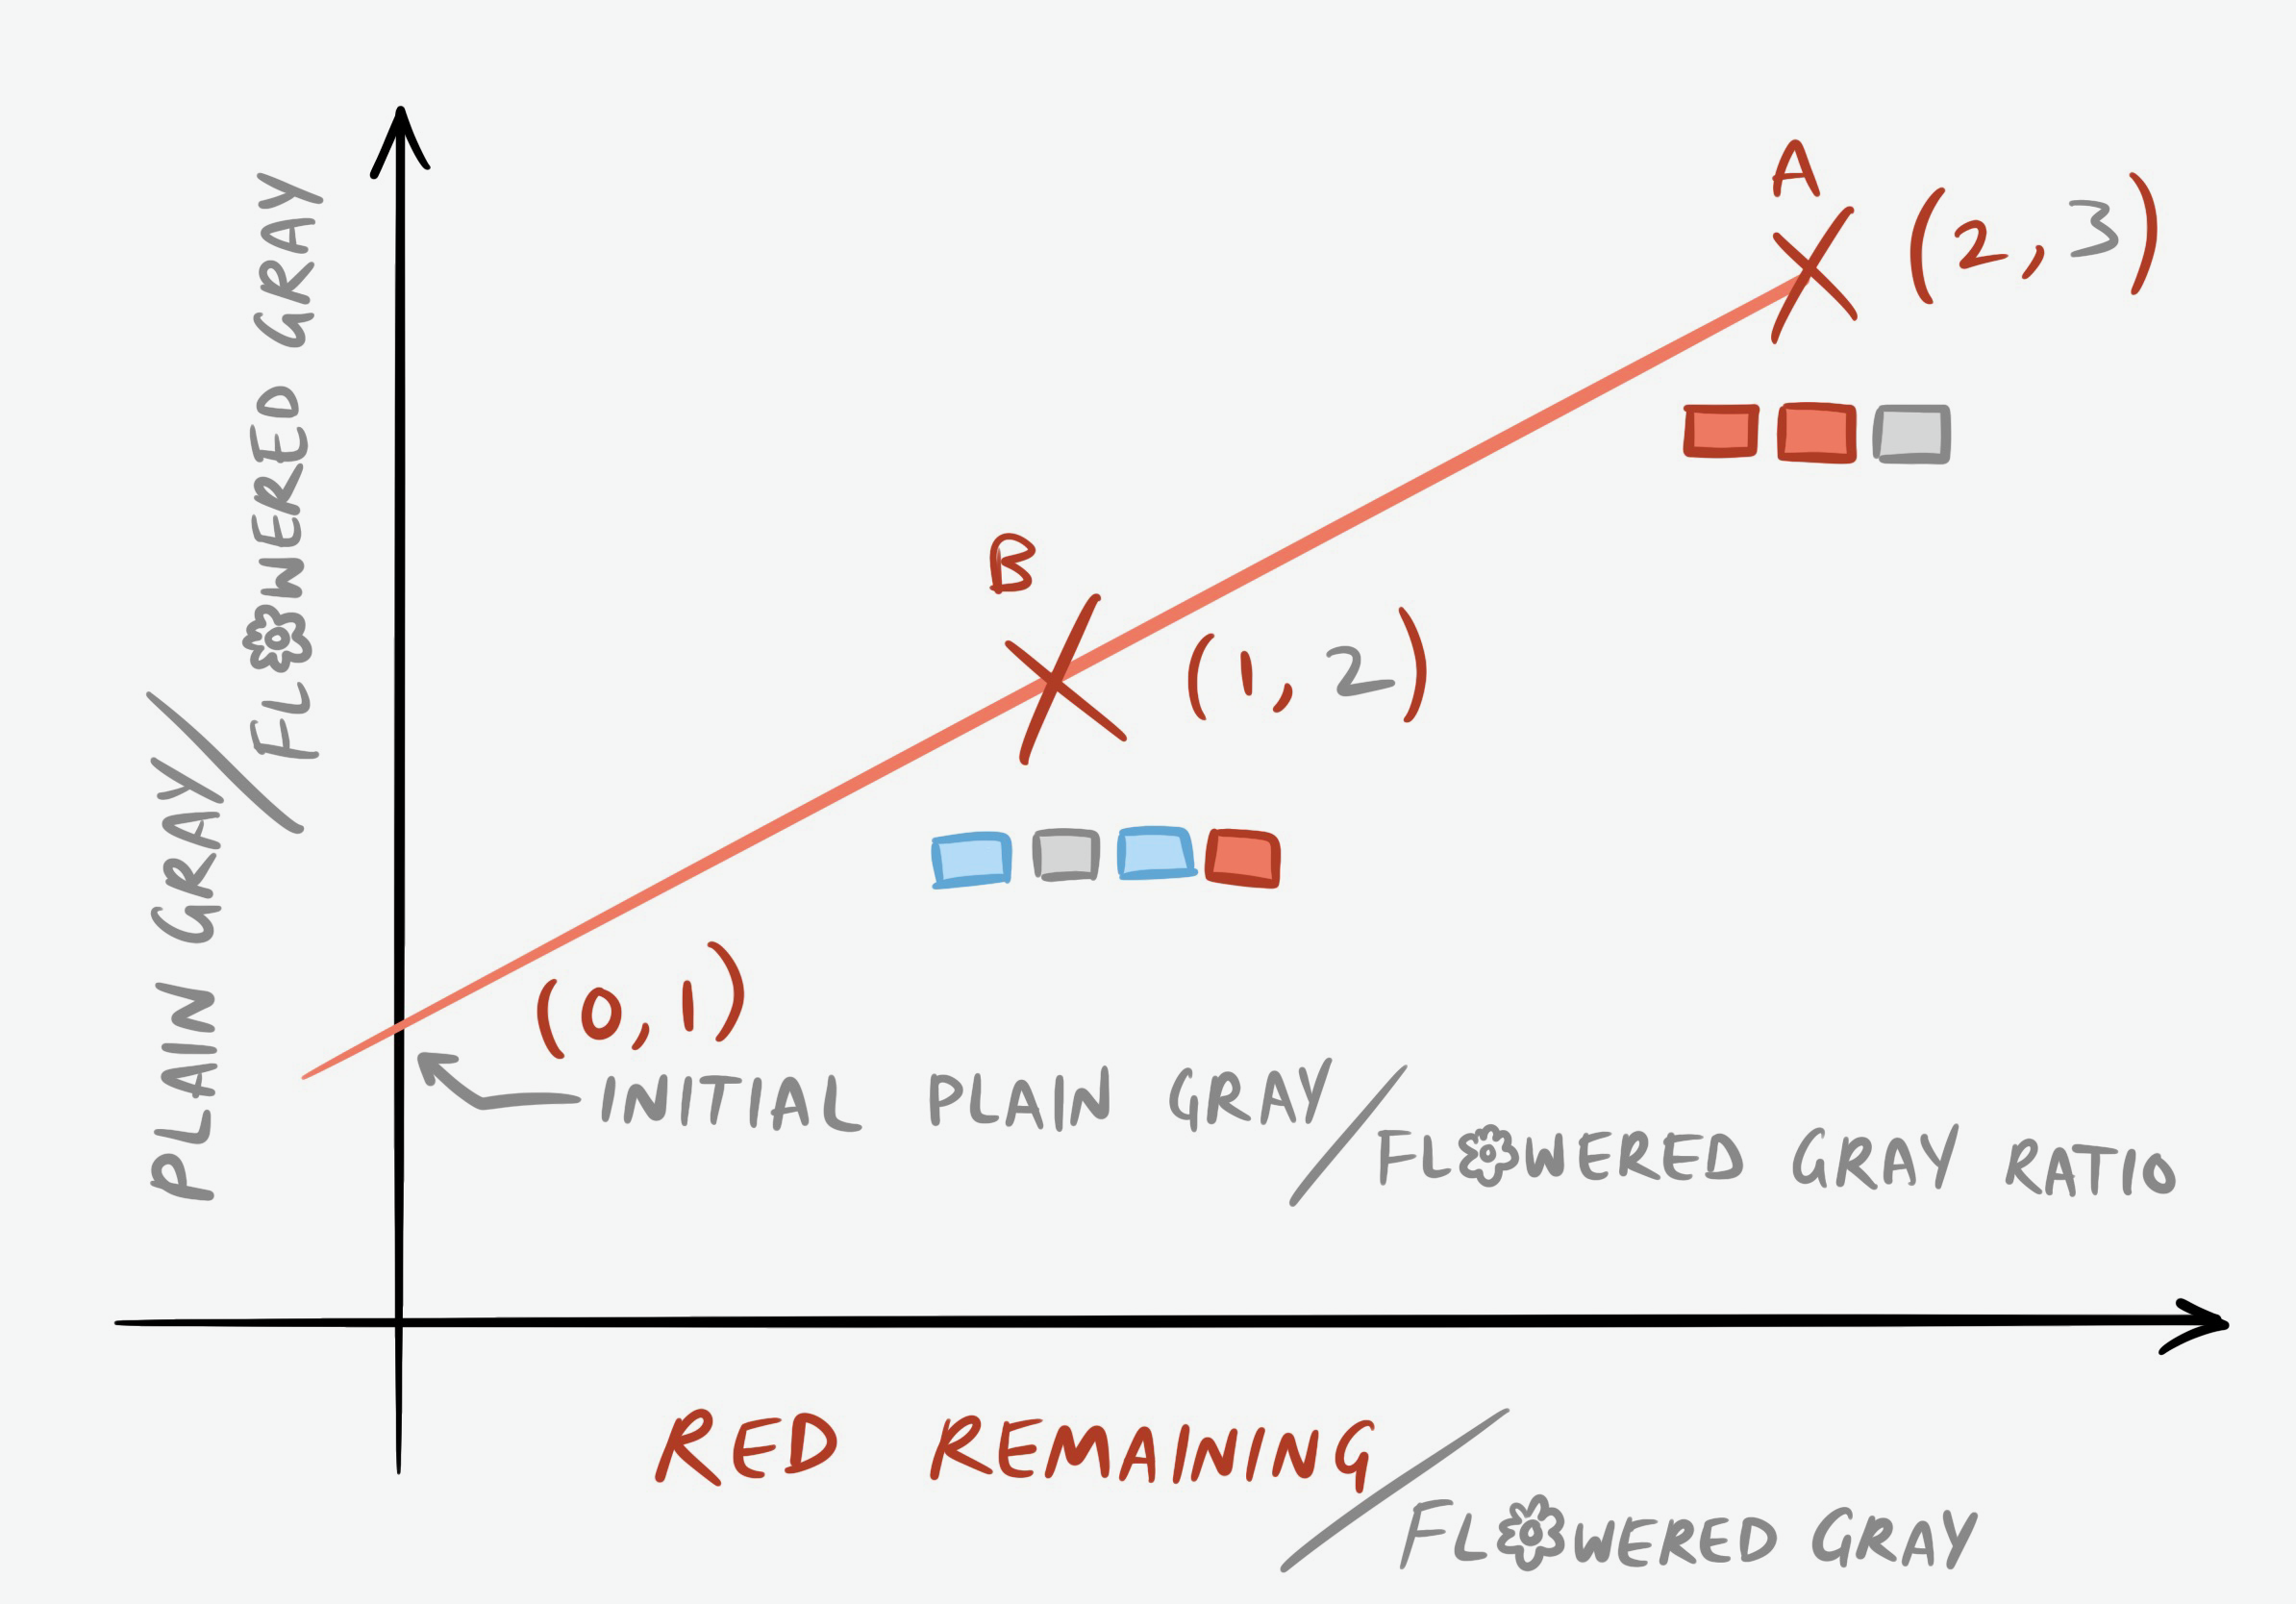
You can think of the (0,1) point as being from a Walkway C, blue-gray-blue-gray, or any other pattern of pavement that contains gray but no red. After a year, the ratio of plain to flowered gray bricks is still one to one, since no new plain bricks were created. Another useful way to think about it is that the y-intercept of 1 represents the starting ratio of plain gray to flowered gray. Even if we didn’t know the starting condition, we could solve for it by taking the equation of a line, \(y=mx+b\), and plugging in the two points of (1,2) and (2,3) that we have. In fact, let’s do that:
\[2=m(1)+b\] \[b=2-m\] \[3=m(2)+b\] \[3=2m+(2-m)\] \[3=m+2\] \[m=1\] \[b=1\] \[y=x+1\]What does our m of 1 mean? We’ll see in a minute.
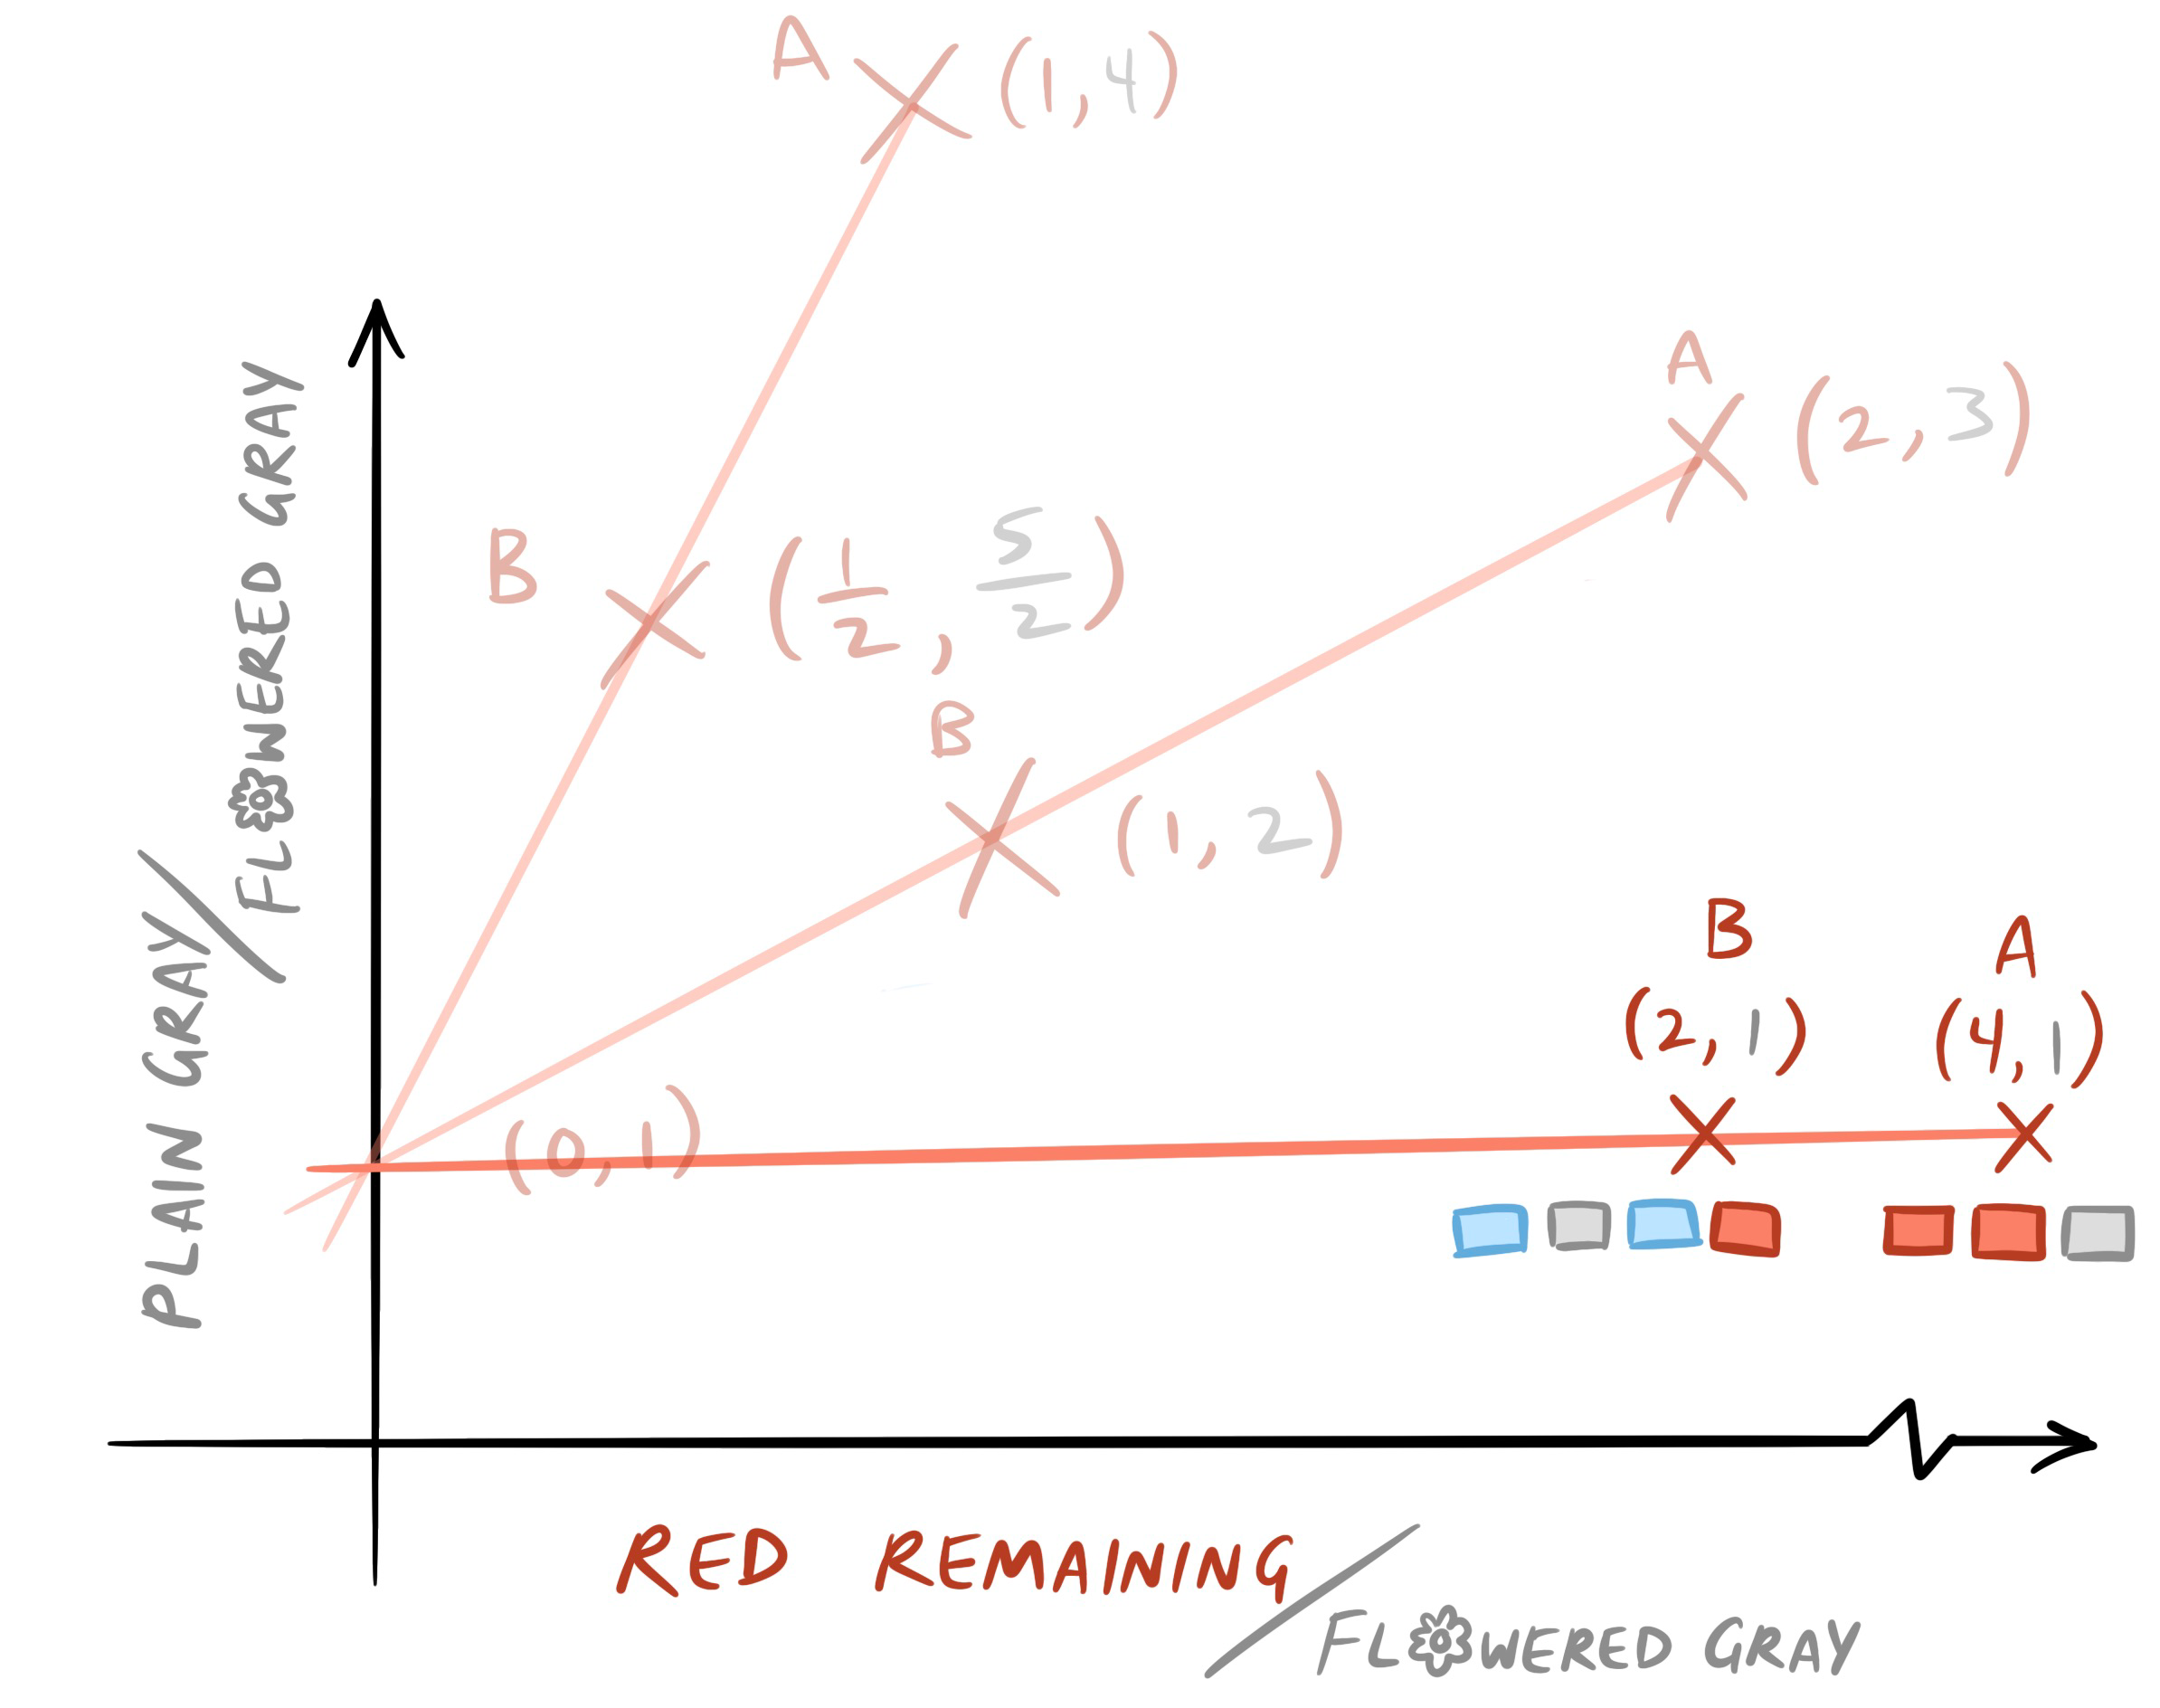
After two years, Walkway A now has only 8 red bricks left, 32 plain gray bricks, and 8 flowered gray bricks, and Walkway B has 24 blue bricks, 3 red, 15 plain gray, and 6 flowered gray. Now the graph looks like this:
What’s the equation of this new line?
\[4=m(1)+b\] \[b=4-m\] \[\frac{5}{2}=m\left(\frac{1}{2}\right)+(4-m)\] \[5=8-m\] \[m=3\] \[b=1\]The intercept hasn’t changed, which is what we expected. But the slope has become steeper, and nonlinearly so. It’s not just equal to the number of half-lives that have passed.
Let’s keep going and see if we notice a pattern. After three years (working with the fact that we now have to use fractional bricks), the equation is \(y=7x+1\), and after four it’s \(y=15x+1\). Over time, the line is rotating counter-clockwise!
Our function \(m(t)\), or slope as a function of time in terms of half-lives, can be listed as follows:
| t | m(t) |
| 0 | 0 |
| 1 | 1 |
| 2 | 3 |
| 3 | 7 |
| 4 | 15 |
Notice a pattern yet? \(m(t)\) appears to be equal to \(2^t-1\). This would predict that \(m(5)=31\), which you can verify for yourself. Now that we know how to relate m to t, we can use any two different minerals as data points and figure out how long it’s been since the rock formed! Woohoo! Using this along with bracketing and biostratigraphy, we’re on our way to figuring out how old fossil organisms are.
Exercises (optional, obviously)
- What do you think the starting conditions look like? Add the t = 0 isochron to the graph and plot points A and B.
- Imagine there was a re-melting and re-cooling event at year 2; in our analogy, this would be like if the pavers came back after two years, tore up all the bricks, and sorted them into piles by what color they are now before re-paving in the same patterns as before. Obviously they’ll have lots of leftover gray bricks; they’ll just leave those out (the walkways will be smaller now). Don’t forget that when choosing a gray brick, they randomly end up with one that either has a flower or doesn’t. What is the equation of the isochron line one year after this event?
Answers are at the end of the post.
Notes
Note 1: In the real world, usually three or more different minerals are used to cross-check the answer. The points should all fall on a line, and if they don’t you know that one of your assumptions broke down–usually, either because the system has either experienced some mixing with the surroundings, throwing off the counts, or the minerals you measured were not actually all formed at the same time. I love how clever scientists are in deducing useful things from obscure clues!
Note 2: Not all types of rock are suitable for isochron dating, since it requires there to be a second, naturally-occurring stable daughter isotope and multiple different types of mineral in the same rock. However, when you can’t use isochron dating, all is not lost! There are a couple of ways to get around this limitation. Certain mineral crystals fortunately include radioactive atoms but exclude all daughter isotopes when they form, allowing you to assume that the starting number of daughter atoms in the crystal is zero. Potassium-argon dating is one of those. For carbon dating, scientists have used all sorts of naturally carbon-storing fossils and structures, such as tree rings, corals, the shells of foraminifera (tiny marine shelly organisms), and stalagmites / stalactites, to create graphs of the proportion of radioactive to nonradioactive carbon present in the atmosphere over the last few thousand years. These are known as calibration curves, and there are many curves depending on whether you’re in the Northern or Southern Hemisphere, in the ocean, or near a nuclear bomb explosion site.
Conclusion
I hope this post was informative and not too hard to follow! If nothing else, I’m happy to have compiled all this into one place on the Internet. While most of us probably won’t have to actually use radiometric dating ourselves at any point (even paleontologists send their samples off to labs that specialize in it), it’s always interesting to understand how we know what we know. Thanks for reading!
Answers to exercises
1 -
2 - It would be the same as the graph of year 1, but shifted up, since now we’re starting with a higher proportion of plain to flowered bricks. The new equation would be \(y=x+\frac{47}{14}\).